Tutorial: LLM Integration
This tutorial explains how to enable and use the LLM (Large Language Model) integration of Optuna Dashboard. With an LLM provider configured, you can interact with the optimization history using natural language—for example, filtering trials or generating Plotly visualizations.
Overview
The LLM integration adds AI-assisted features on top of the existing dashboard experience. Currently supported capabilities include:
- Natural language to trial-filter function generation
Example query: “Show completed trials where param x is between 1 and 5 and the objective value is below -10”
The model returns a JavaScript function, which is safely evaluated client-side to filter trials.
- Automatic generation of Plotly charts from natural language prompts.
Example query: “Draw a parallel coordinates plot to visualize the relationships between the objective value and the hyperparameters.”
The model returns a JavaScript function to generate Plotly charts.
Supported providers: OpenAI, AzureOpenAI, and OpenAI-compatible endpoints.
Usage
Command-line Interface
Configuration is typically provided in a TOML file and passed with --from-config.
[optuna_dashboard]
storage = "sqlite:///example.db"
port = 8080

[llm.openai]
model = "gpt-5-mini"             # Model name
use_chat_completions_api = true  # If true uses Chat Completions API; otherwise Responses API

[llm.openai.client]
api_key = "sk-your-api-key"      # For security, you can omit this line and keep the secrets in the OPENAI_API_KEY environment variable.
base_url = "https://api.openai.example.com/v1"  # Set for compatible services
Once you have a config file:
optuna-dashboard --from-config config.toml
For more details on configuration, see LLM Integration.
Python API
You can launch the dashboard programmatically and provide an llm_provider.
The examples below mirror the structure of the TOML configuration but give you full control in Python.
import os
import openai
from optuna_dashboard.llm.openai import OpenAI
from optuna_dashboard import run_server

client = openai.OpenAI(
    api_key=os.environ["OPENAI_API_KEY"],
    # base_url="https://api.openai.example.com/v1",  # Uncomment for compatible endpoints
)
llm_provider = OpenAI(client, model="gpt-5-mini", use_chat_completions_api=False)

run_server(
    storage="sqlite:///example.db",
    port=8080,
    llm_provider=llm_provider,
)
Features
Smart Filtering
One of the features enabled when an LLM provider is configured is Smart Filtering. With smart filtering, you can input filter conditions in natural language. The LLM then generates a corresponding JavaScript function, which is applied to filter trials dynamically.
This feature is currently available in the “Smart Selection” and “Trial (List)” tabs. For example, in the “Smart Selection” tab, you can use it as follows:
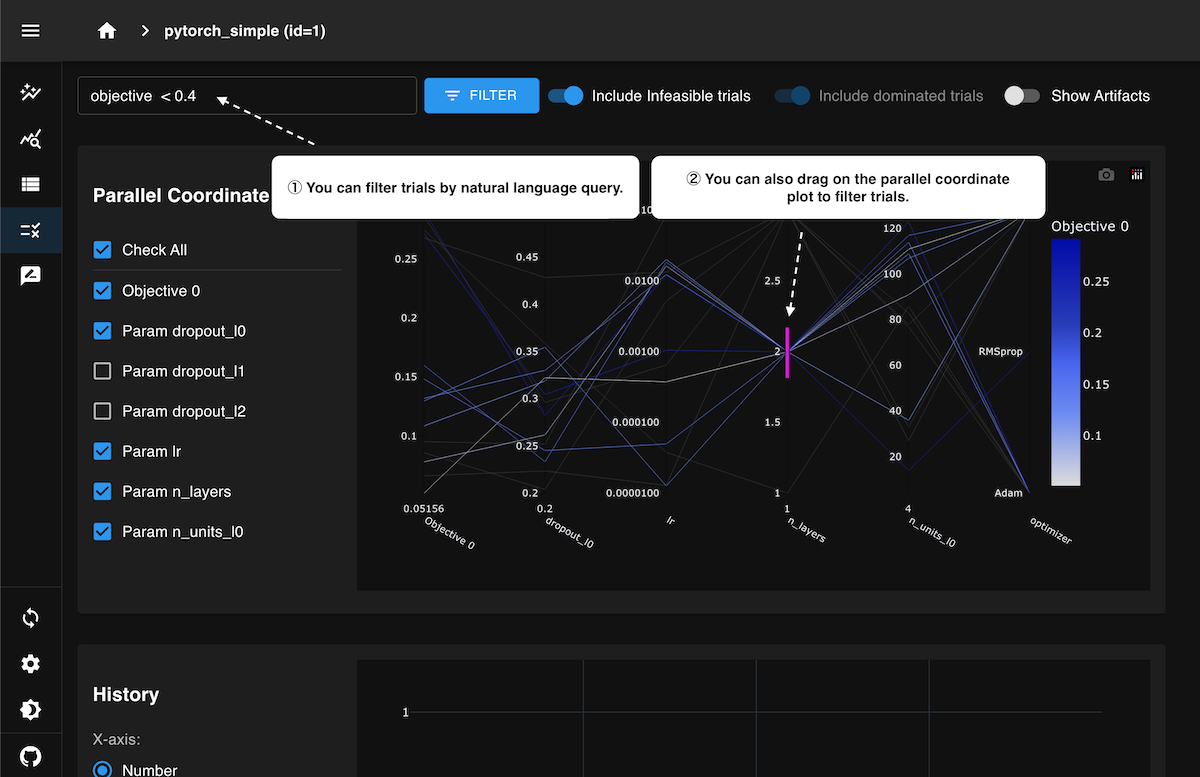
As shown in the animation above, when you specify conditions in natural language in the filter input field, the results are reflected in the parallel coordinates plot, optimization history plot, and trial table. It also supports multiple conditions combined together, such as:
objective < 0.5 and (param_a < 0.1 or param_b > 10) and state is complete
Automatic Plotly Charts Generation
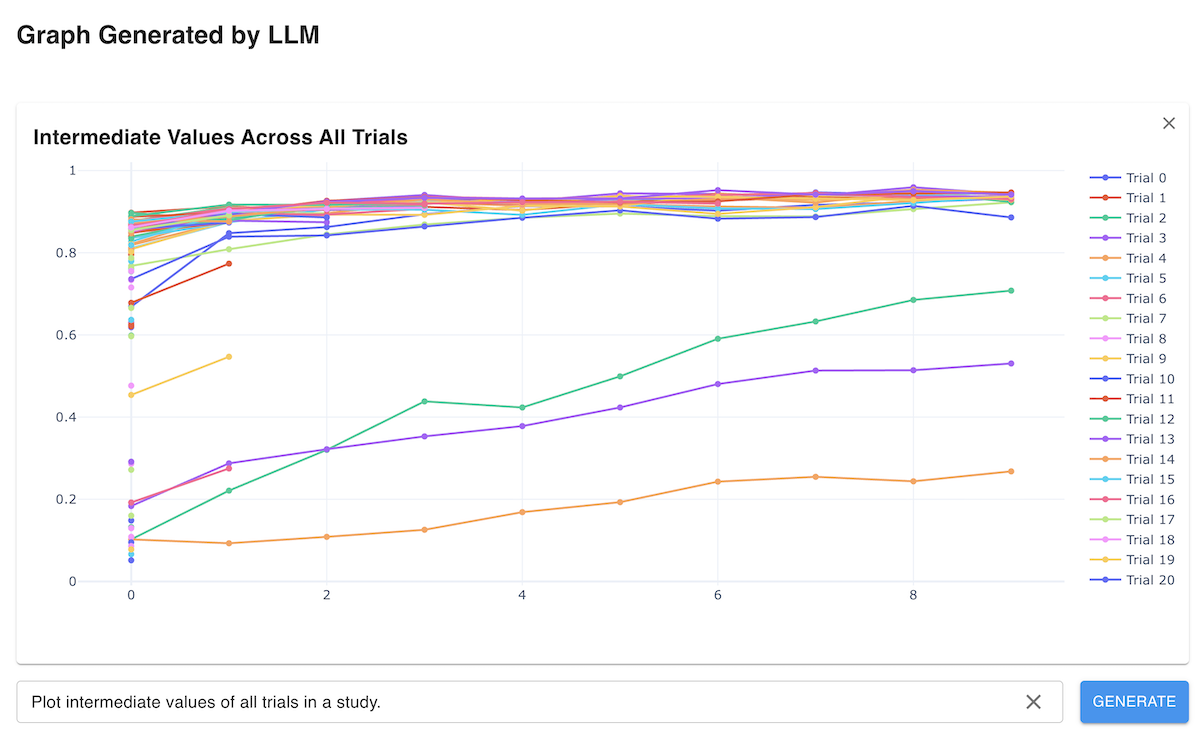
This feature enables automated chart creation from natural language prompts and is available in the “Analytics” tab. Previously, Optuna Dashboard provided a set of predefined visualizations for optimization tasks, such as optimization history plots, Pareto fronts, and contour plots. However, supporting custom visualizations tailored to specific tasks—especially those needed only occasionally—was challenging.
With this capability, users can ask the LLM to create custom visualizations by simply describing what they want to see. The LLM interprets the request and generates a JavaScript function that uses Plotly.js to render the custom chart. This allows users to flexibly create domain- or task-specific charts that go beyond the built-in visualization types, significantly enhancing the analytical capabilities of the dashboard.