Tutorial: Human-in-the-loop Optimization using Objective Form Widgets
In tasks involving image generation, natural language, or speech synthesis, evaluating results mechanically can be tough, and human evaluation becomes crucial. Until now, managing such tasks with Optuna has been challenging. However, the introduction of Optuna Dashboard enables humans and optimization algorithms to work interactively and execute the optimization process.
In this tutorial, we will explain how to optimize hyperparameters to generate a simple image using Optuna Dashboard. While the tutorial focuses on a simple task, the same approach can be applied to for instance optimize more complex images, natural language, and speech.
The tutorial is organized as follows:
What is human-in-the-loop optimization?
Main tutorial
Theme
System architecture
Steps
Script explanation
What is human-in-the-loop optimization?
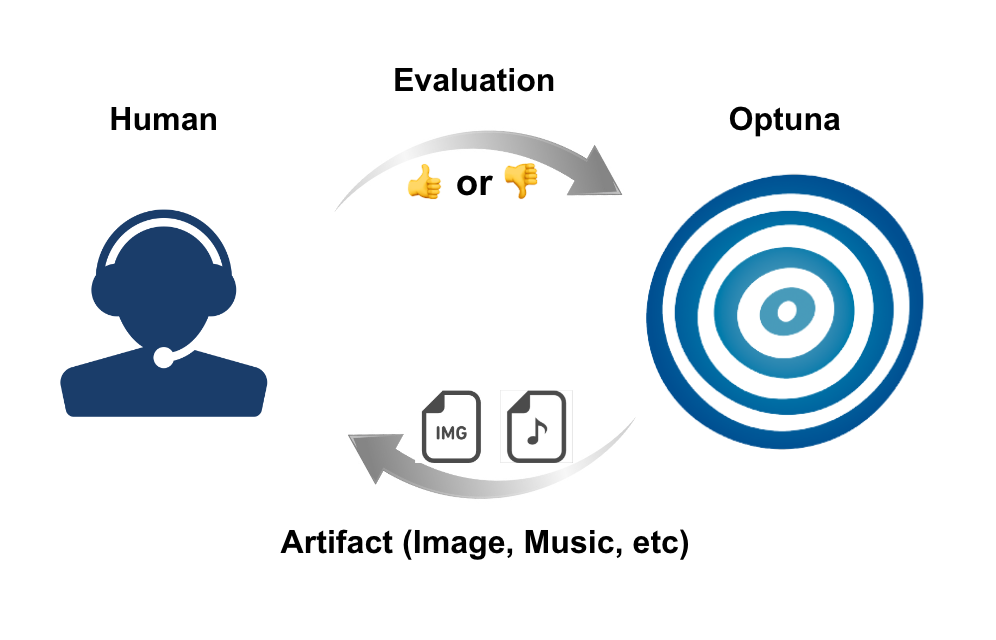
Human-in-the-loop (HITL) is a concept where humans play a role in machine learning or artificial intelligence systems. In HITL optimization in particular, humans are part of the optimization process. This is useful when it’s difficult for machines to evaluate the results and human evaluation is crucial. In such cases, humans will assess the results instead.
Generally, HITL optimization involves the following steps:
An output is computed given the hyperparameters suggested by an optimization algorithm
An evaluator (human) evaluates the output
Steps 1 to 2 are repeated to find the best hyperparameters.
HITL optimization is valuable in areas where human judgment is essential, like art and design, since it’s hard for machines to evaluate the output. For instance, it can optimize images created by generative models or improve cooking methods and ingredients for foods like coffee.
Main tutorial
Theme
In this tutorial, we will interactively optimize RGB values between 0 and 255 to generate a color that the user perceives as the “color of the sunset.” If someone already knows the RGB hyperparameter characteristics for their ideal “color of the sunset,” they can specify those values directly. However, even without knowing such characteristics, interactive optimization allows us to find good hyperparameters. Although the task is simple, this serves as a practical introduction to human-in-the-loop optimization, and can be applied to image generation, natural language generation, speech synthesis, and more.


To implement HITL optimization, you need a way to interactively execute the optimization process, typically through a user interface (UI) or other means. Usually, users would have to implement their own, but with Optuna Dashboard, everything is already set up for you. This is a major advantage of using Optuna Dashboard for this purpose.
System architecture
The system architecture for this tutorial’s example is as follows:
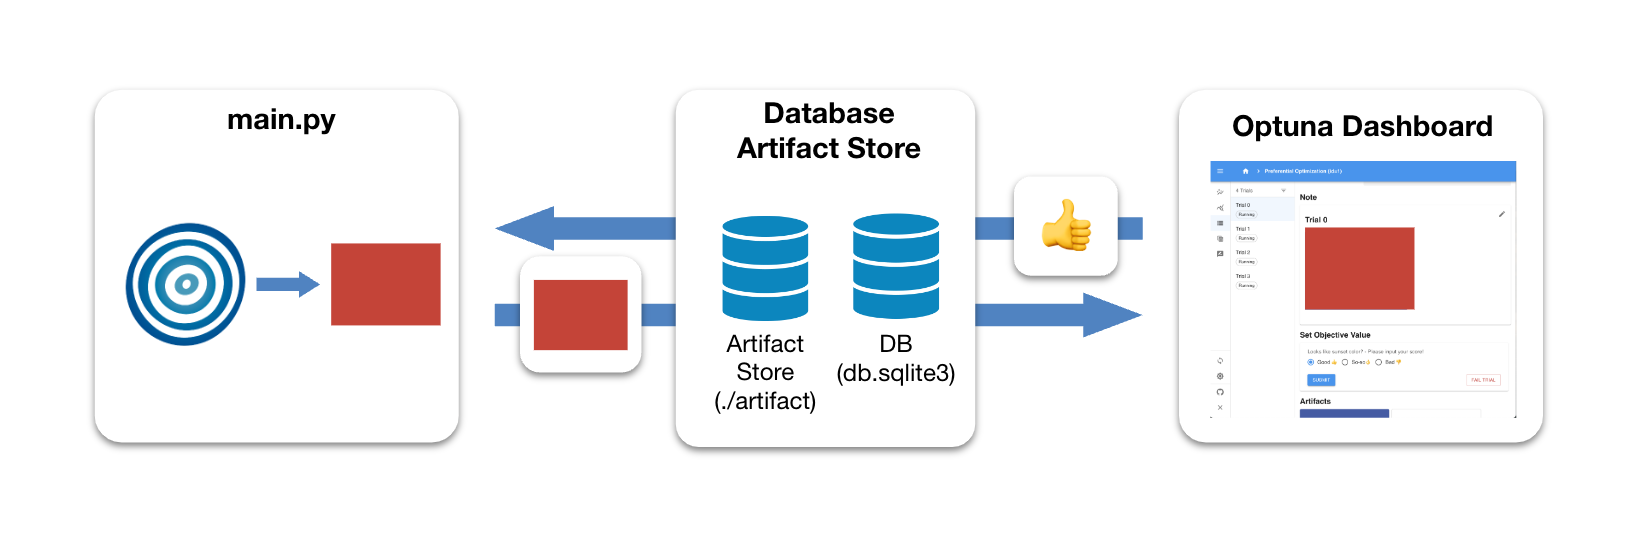
In HITL optimization using Optuna Dashboard, there are primarily the following components:
Optuna Dashboard for displaying the outputs and making evaluations
Database and File Storage to store the experiment’s data (Study)
Script that samples hyperparameters from Optuna and generates outputs
The DB is the place where the information of the Study is stored. The Artifact Store is a place for storing artifacts (data, files, etc.) for the Optuna Dashboard. In this case, it is used as a storage location for the RGB images.
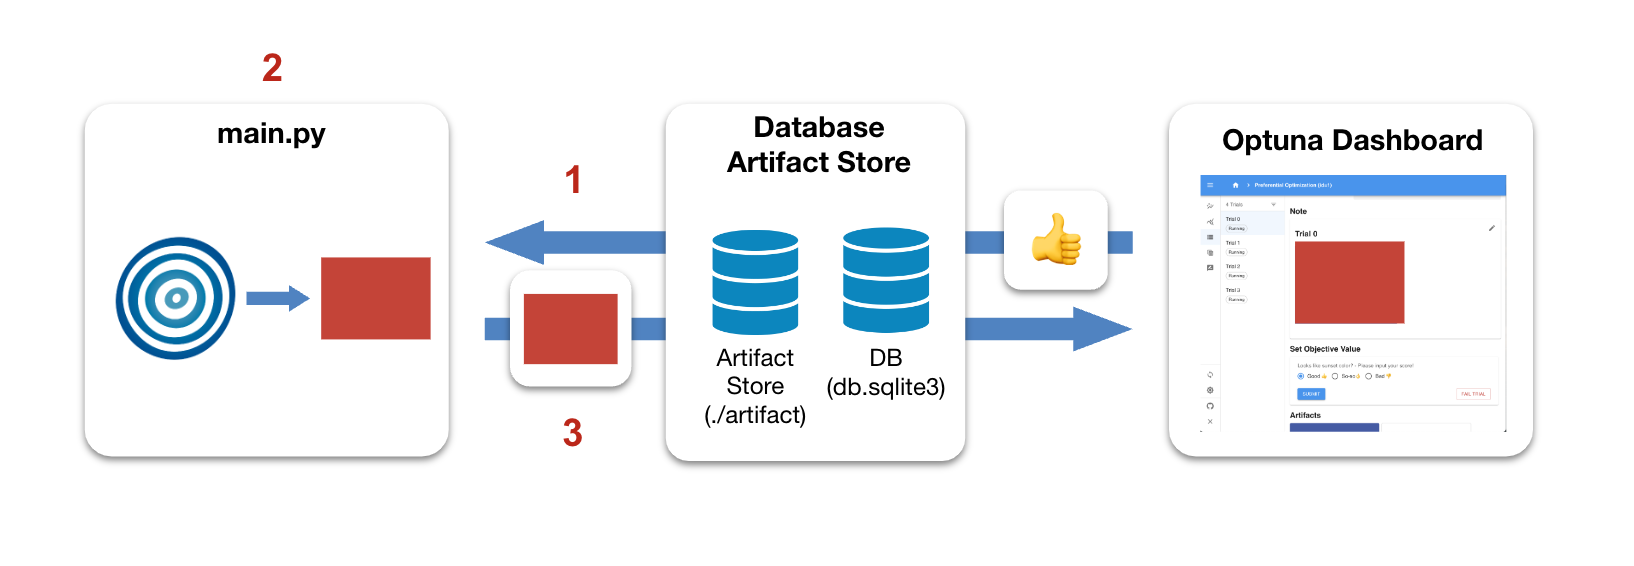
Our script repeatedly performs these steps:
Monitor the Study’s state to maintain a constant number of Trials in progress (Running).
Sample hyperparameters using the optimization algorithm and generate RGB images.
Upload the generated RGB images to the Artifact Store.
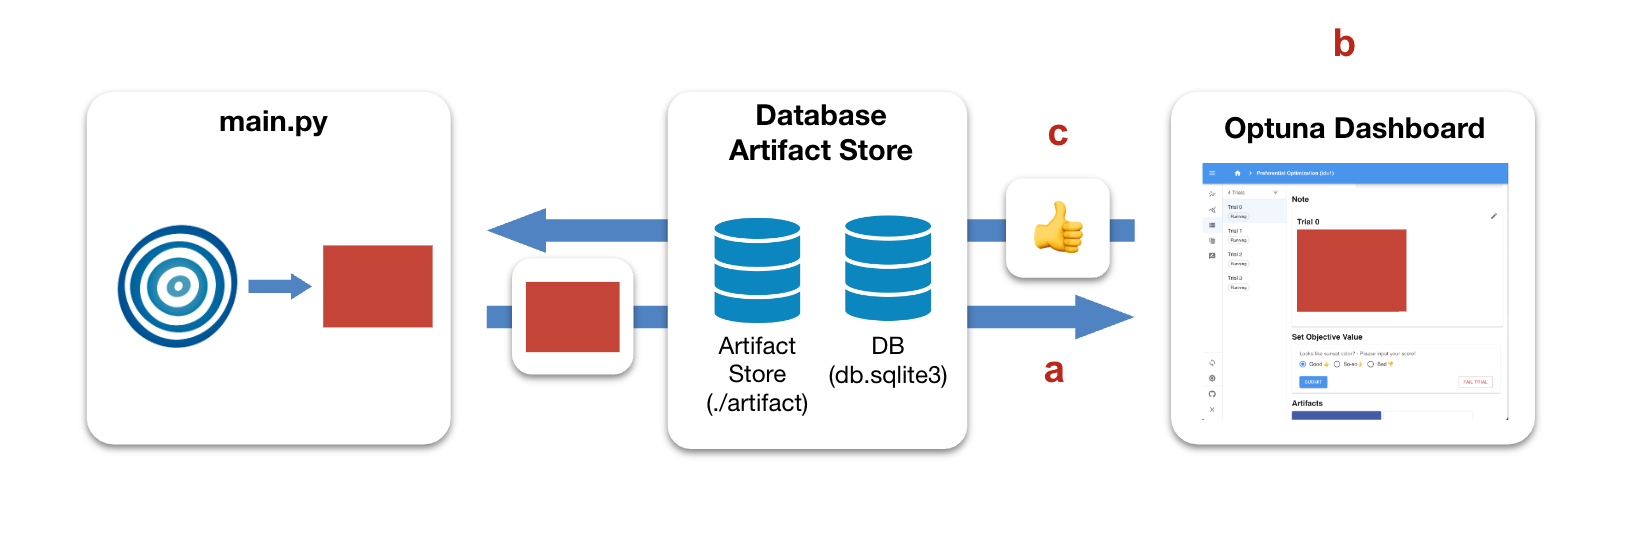
Additionally, the evaluator, Optuna Dashboard, and Optuna perform the following processes:
Optuna Dashboard retrieves the RGB images uploaded to the Artifact Store and displays the retrieved RGB images to the evaluator
The evaluator reviews the displayed RGB images and inputs their evaluation of how close the displayed image is to the “color of the sunset” into the Optuna Dashboard
Optuna Dashboard saves the evaluation results in the database
In the example of this tutorial, processes 1-3 and a-c are executed in parallel.
Steps
Given the above system, we carry out HITL optimization as follows:
Environment setup
Execution of the HITL optimization script
Launching Optuna Dashboard
Interactive HITL optimization
Environment setup
To run the script used in this tutorial, you need to install following libraries:
$ pip install "optuna>=3.3.0" "optuna-dashboard>=0.12.0" pillow
You will use SQLite for the storage backend in this tutorial. Ensure that the following library is installed:
Execution of the HITL optimization script
Run a python script below which you copied from main.py
$ python main.py
Launching Optuna Dashboard
Run this command to launch Optuna Dashboard in a separate process.
$ optuna-dashboard sqlite:///db.sqlite3 --artifact-dir ./artifact
In the command, the storage is set to sqlite:///db.sqlite3 to persist Optuna’s trial history. To store the artifacts, --artifact-dir ./artifact is specified.
Listening on http://127.0.0.1:8080/
Hit Ctrl-C to quit.
When you run the command, you will see a message like the one above. Open http://127.0.0.1:8080/dashboard/ in your browser.
Interactive HITL optimization
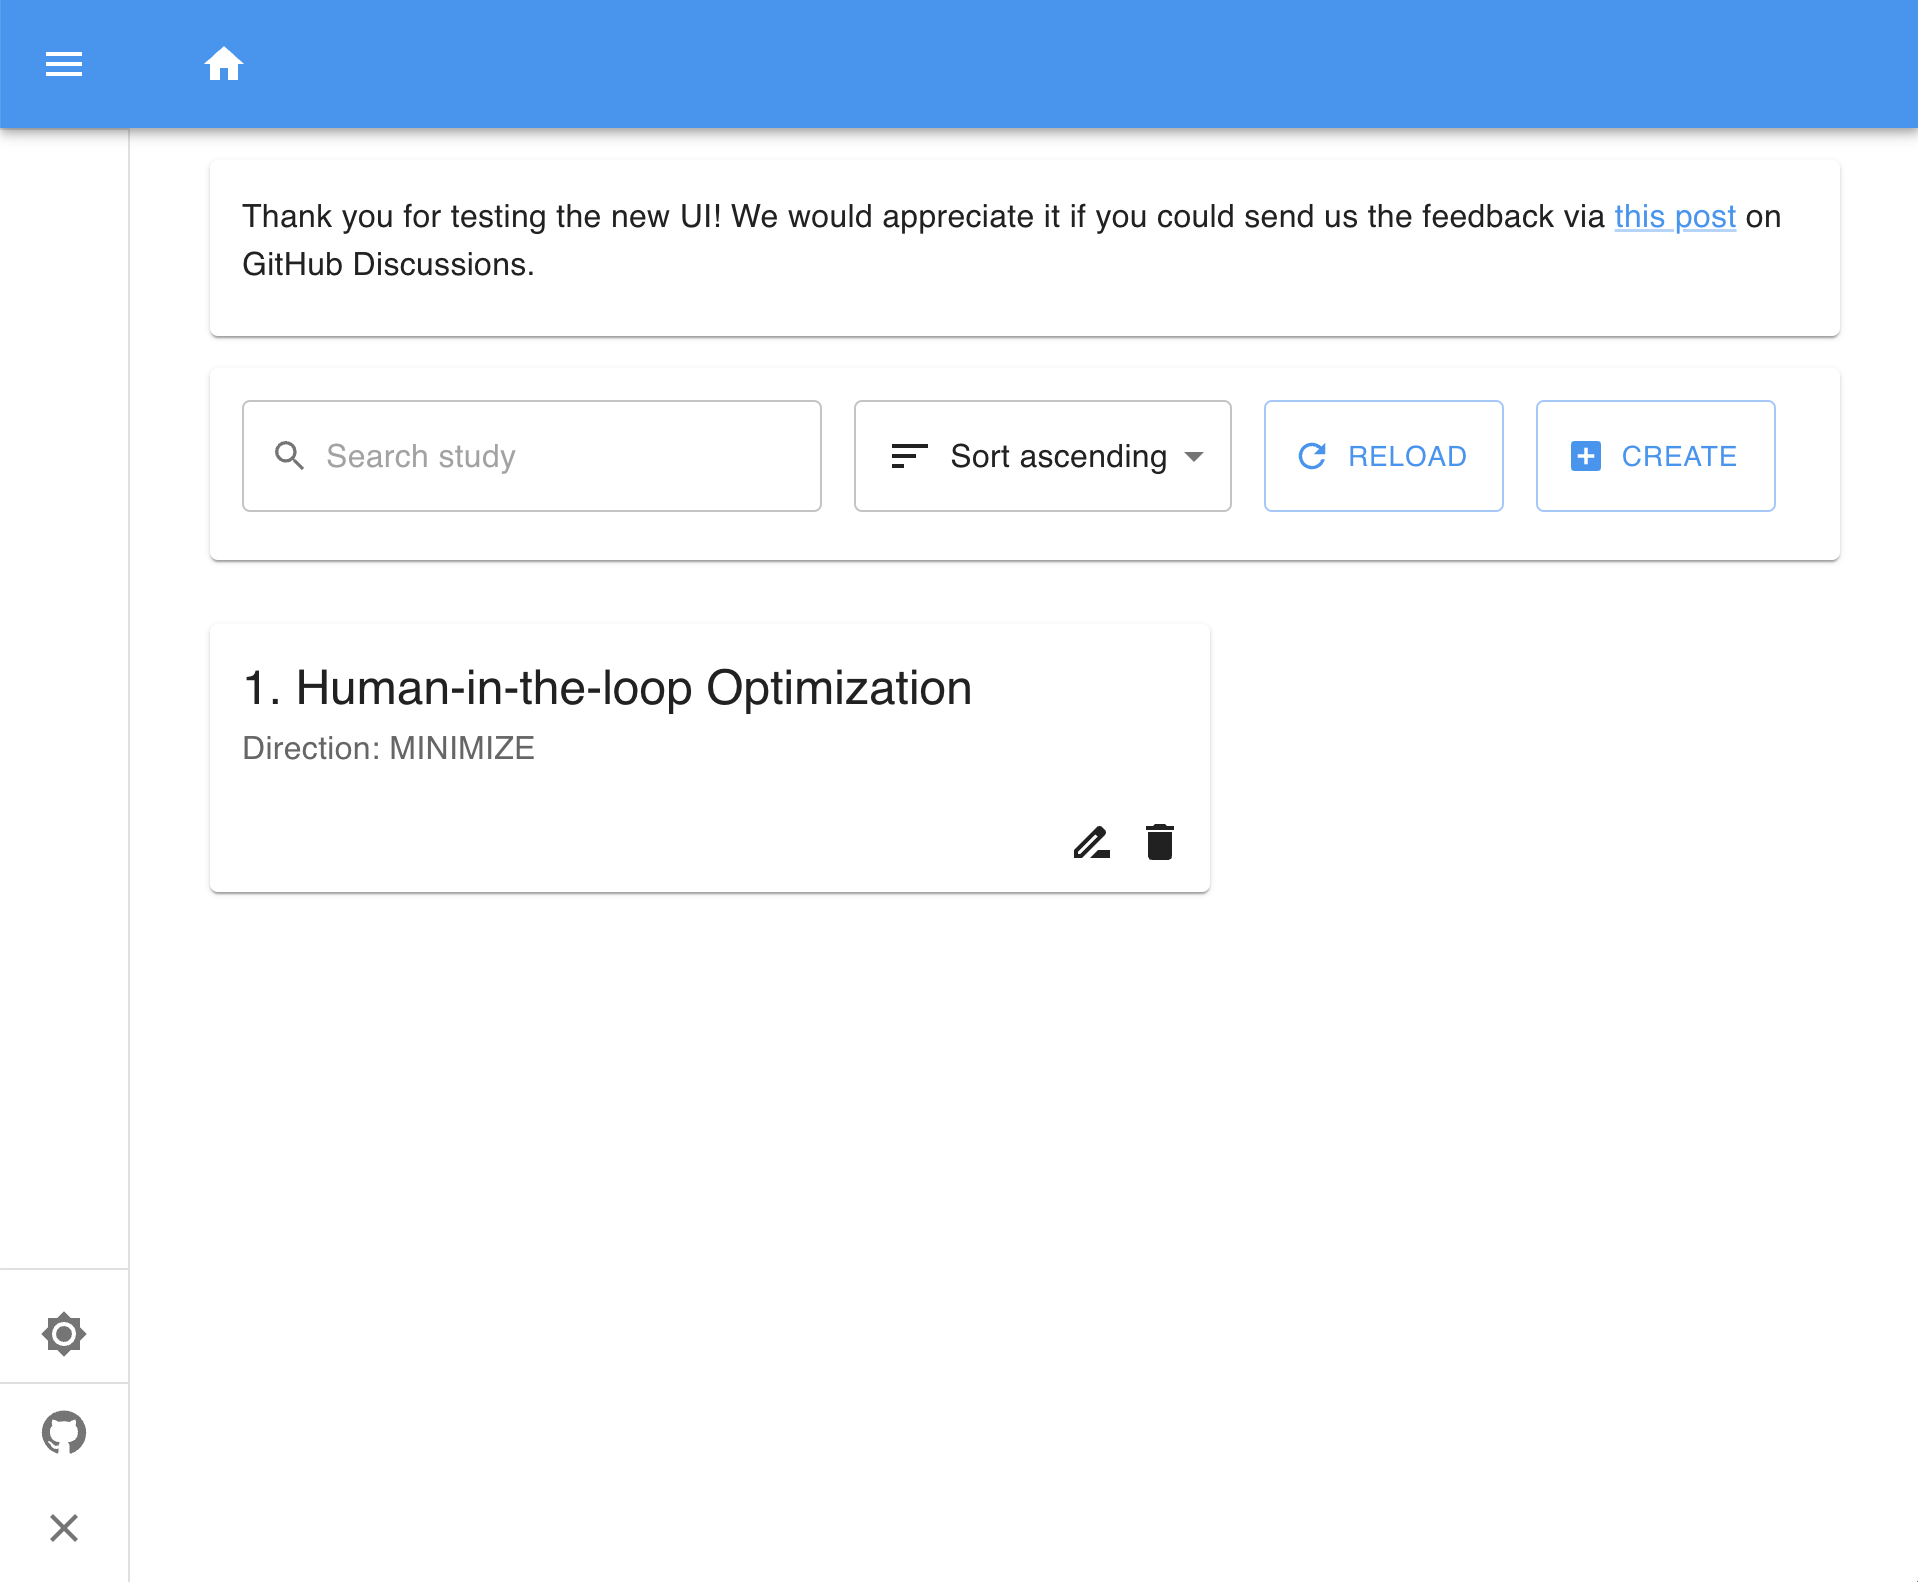
You will see the main screen.
In this example, a study is created with the name “Human-in-the-loop Optimization.” Click on it. You will be directed to the page related to that study.
Click the third item in the sidebar. You will see a list of all trials.
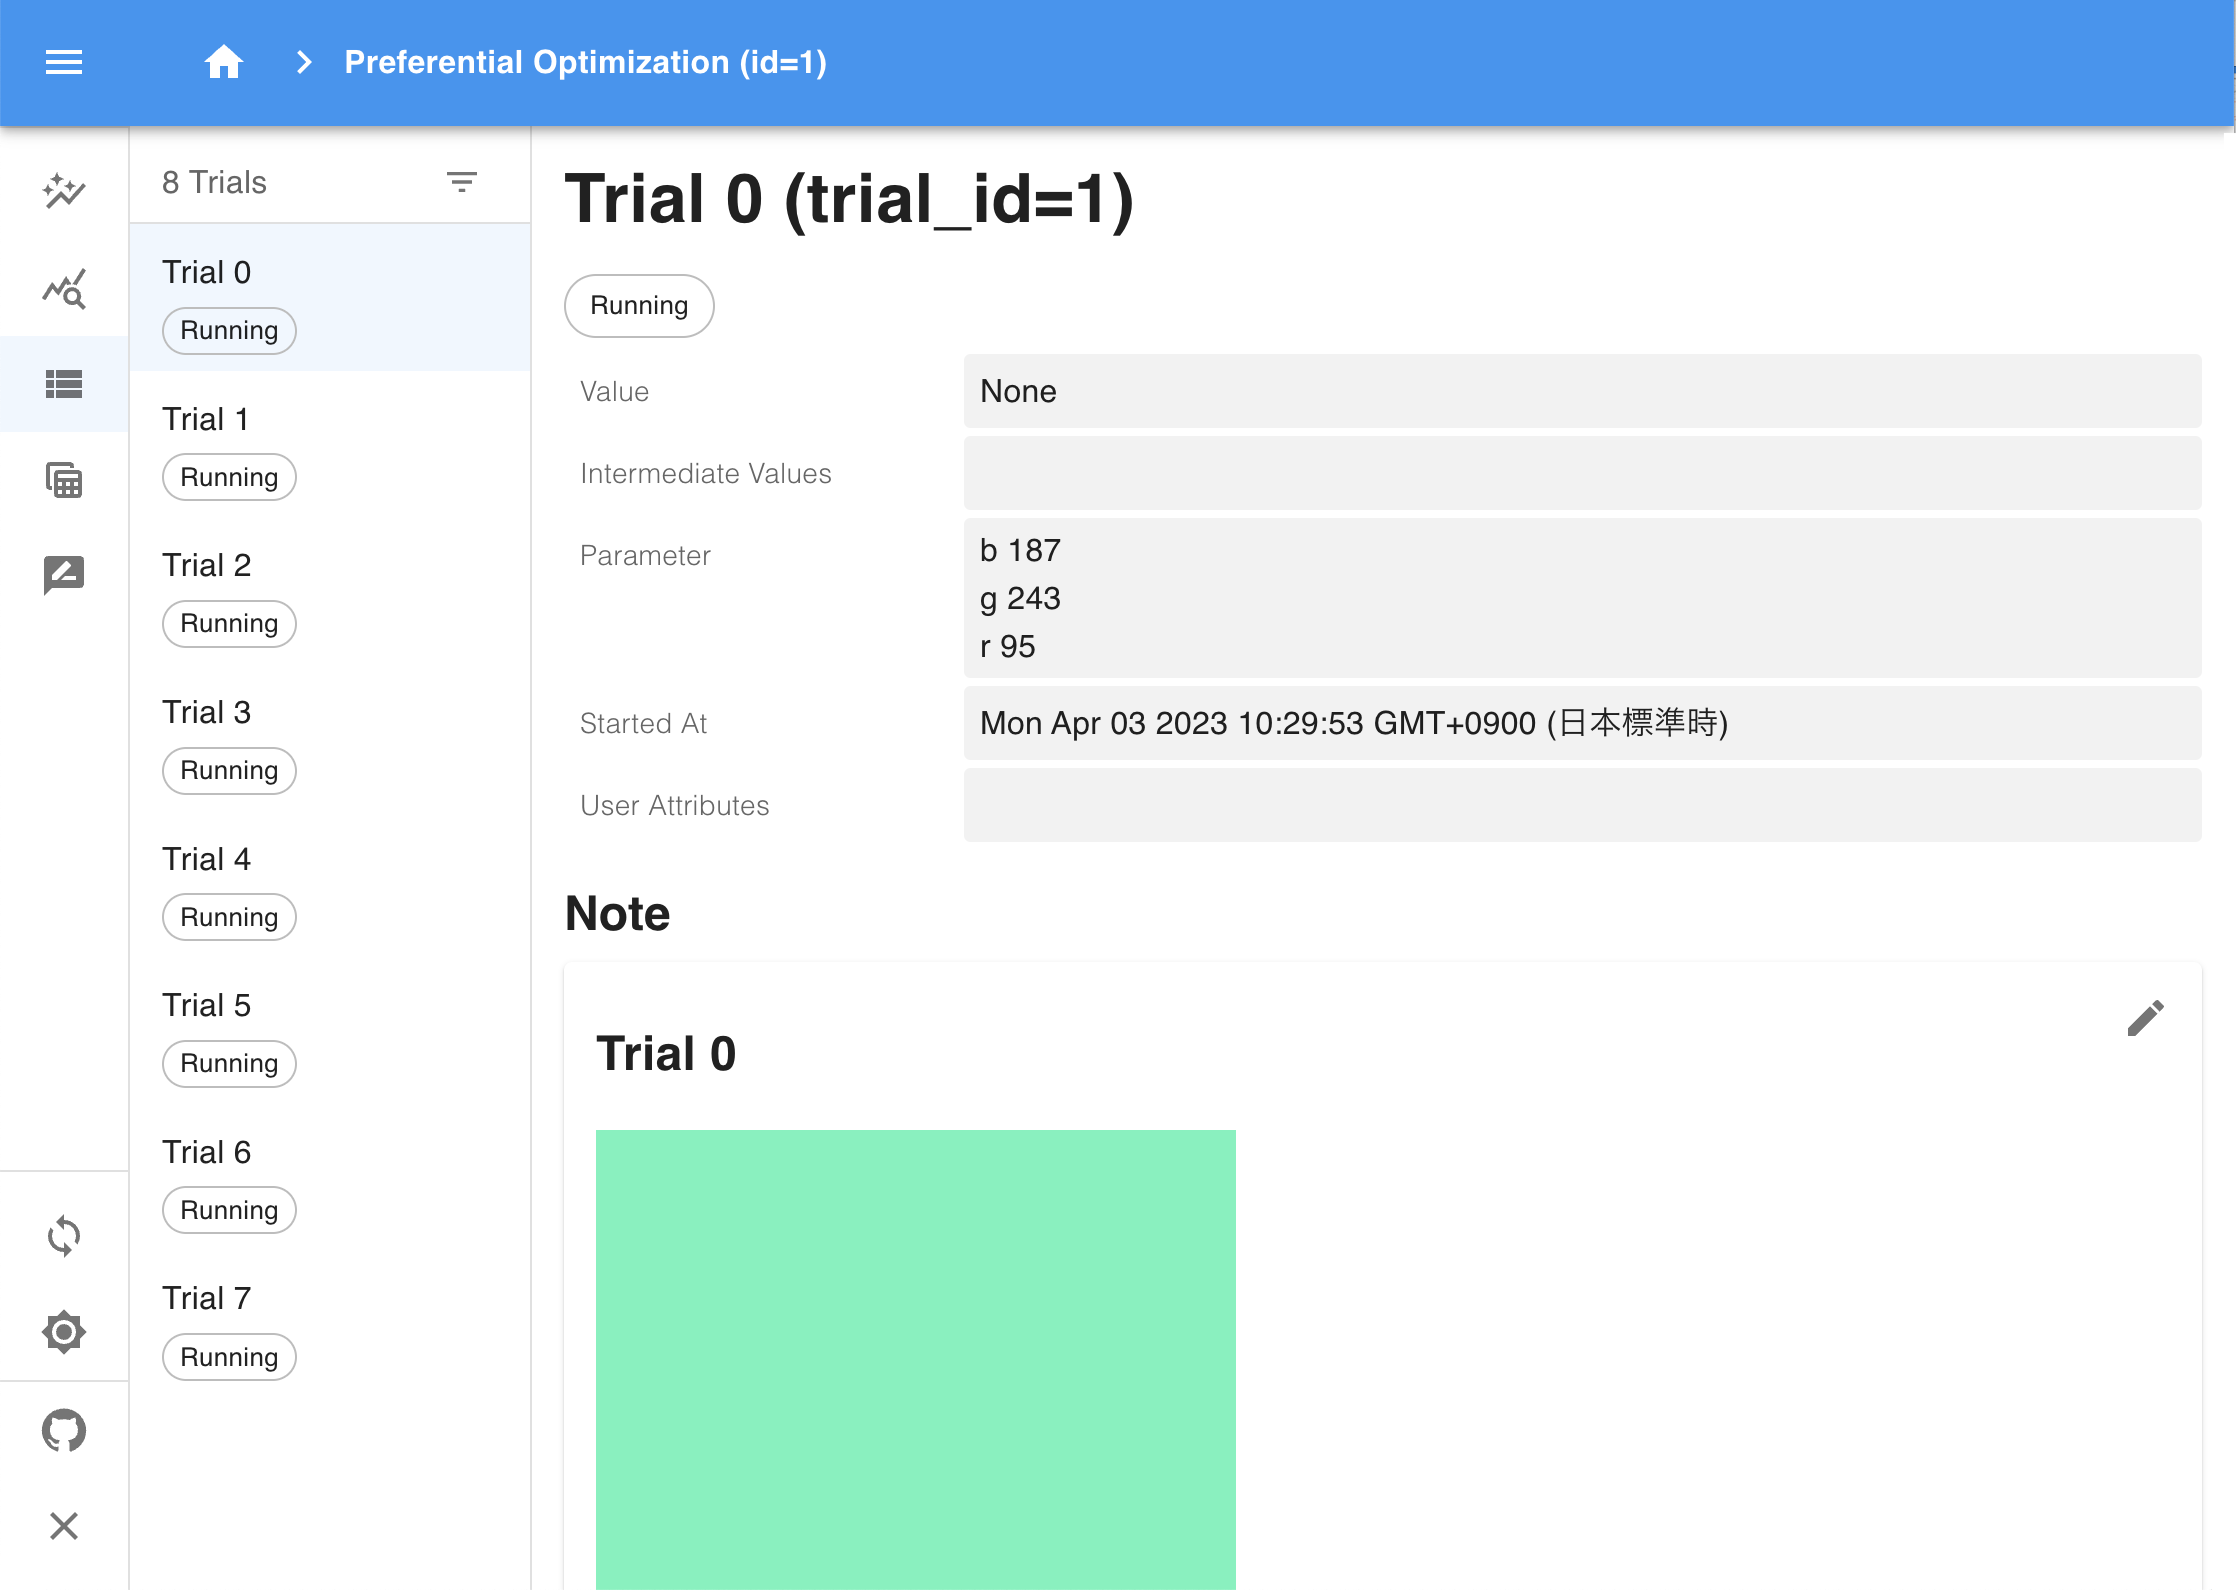
For each trial, you can see its details such as RGB parameter values and importantly, the generated image based on these values.
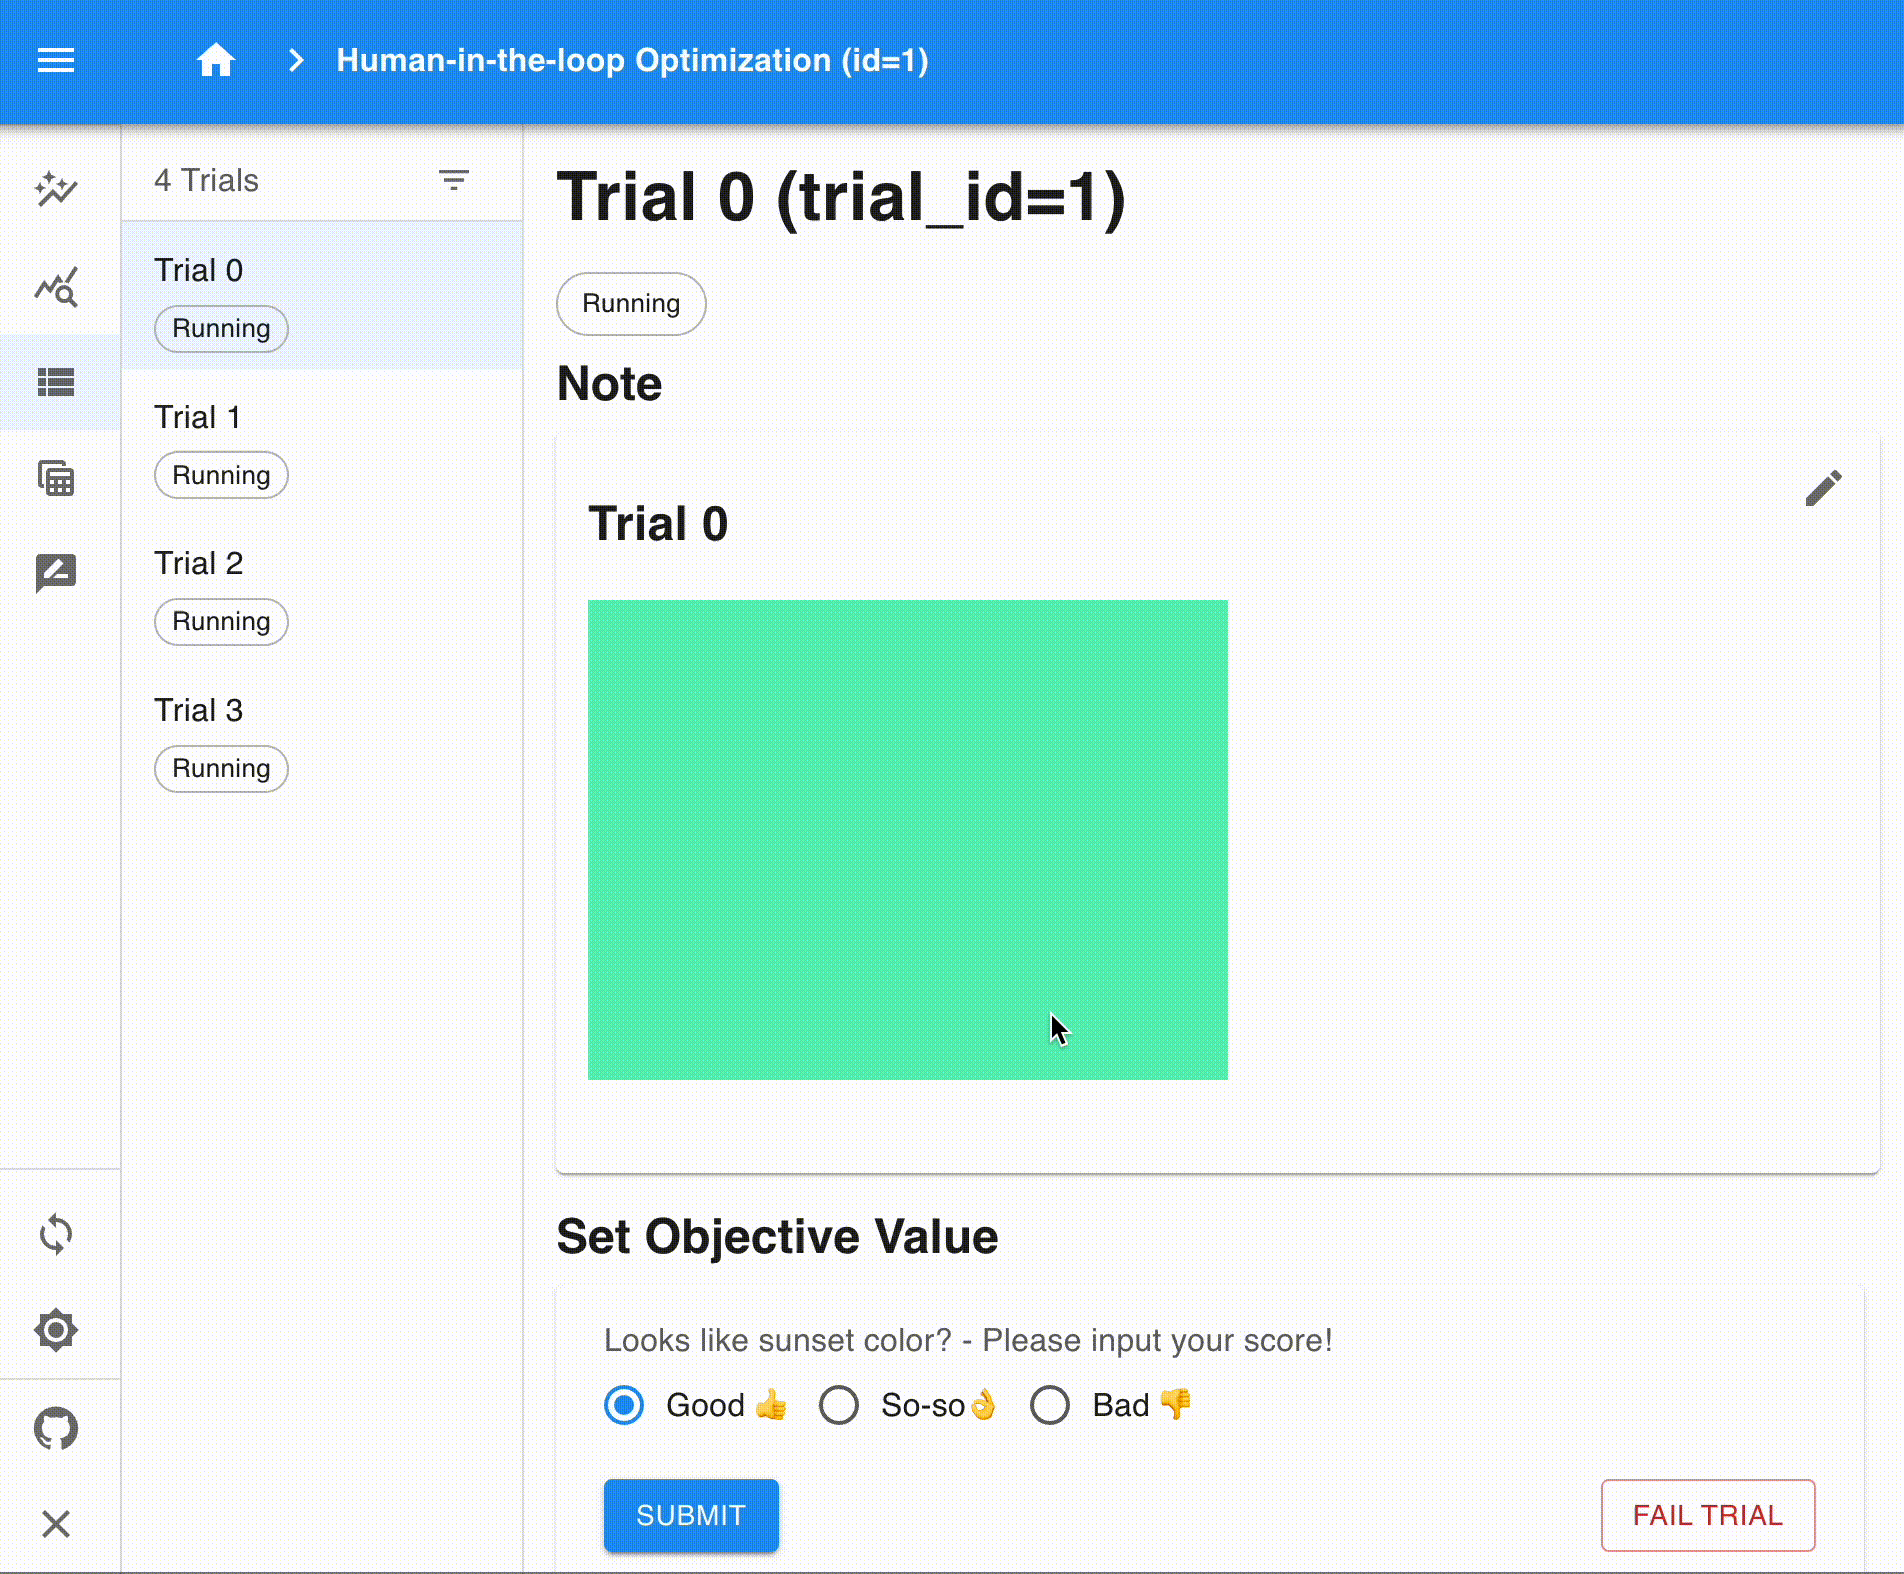
Let’s evaluate some of the images. For the first image, which is far from the “color of the sunset,” we rated it as “Bad.” For the next image, which is somewhat closer to the “color of the sunset,” we rated it as “So-so.” Continue this evaluation process for several trials. After evaluating about 30 trials, we should see an improvement.
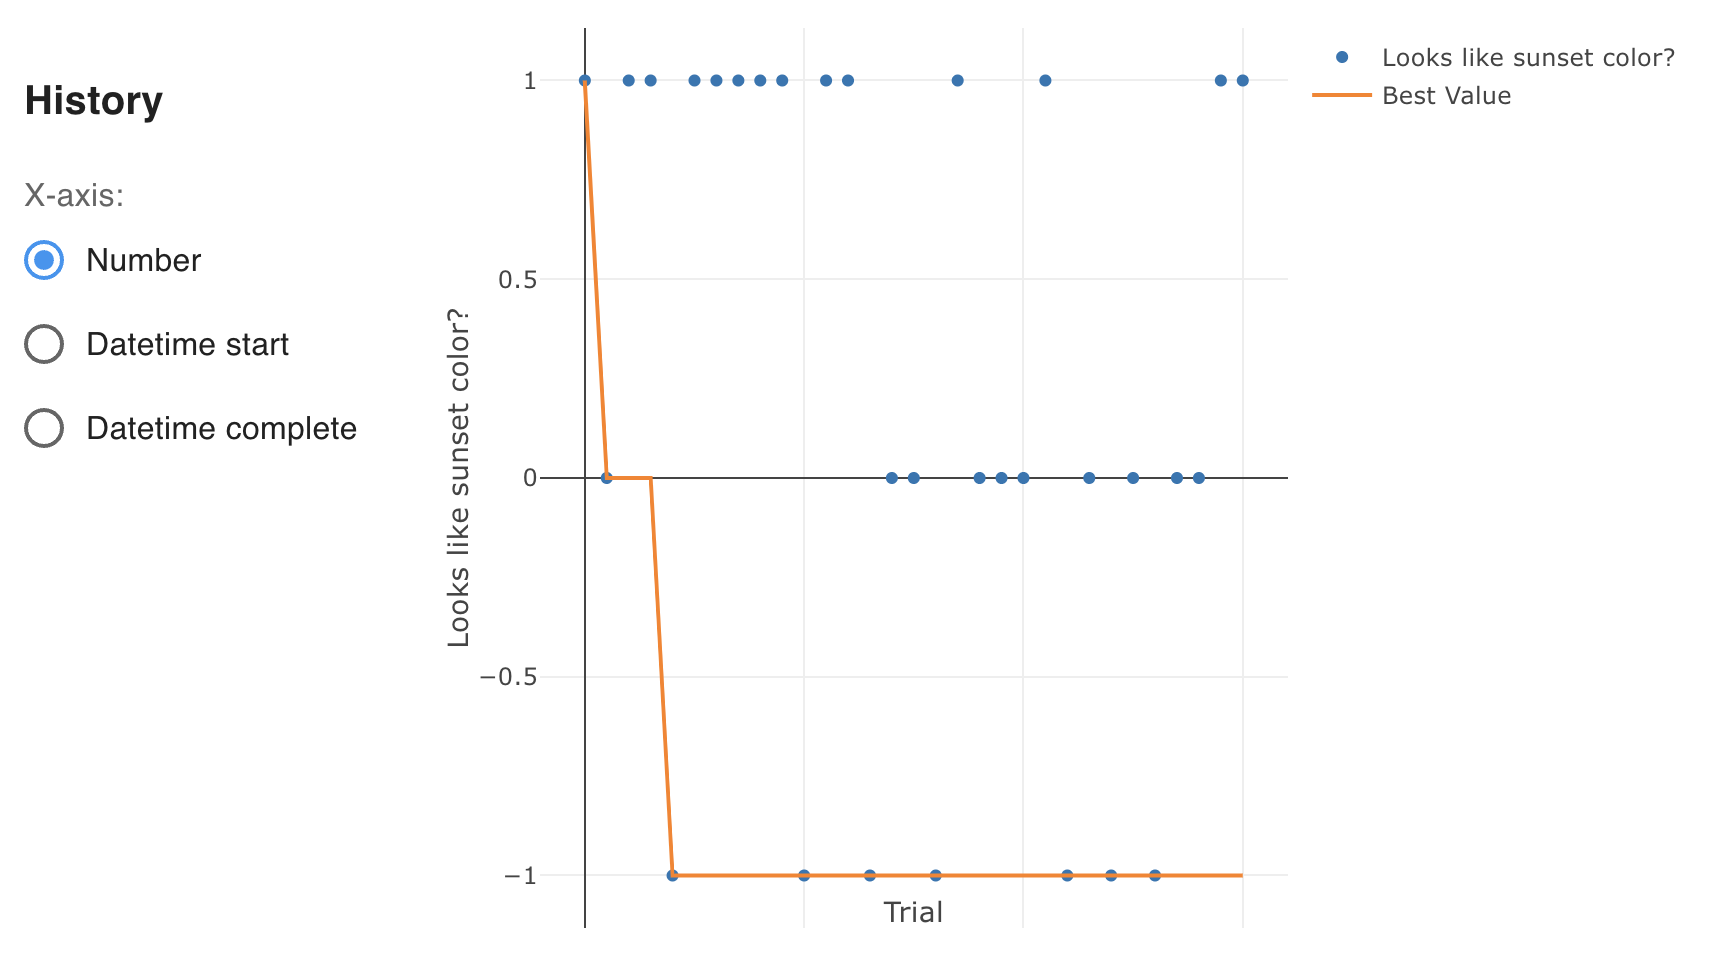
We can review the progress of the HITL optimization through graphs and other visualizations.
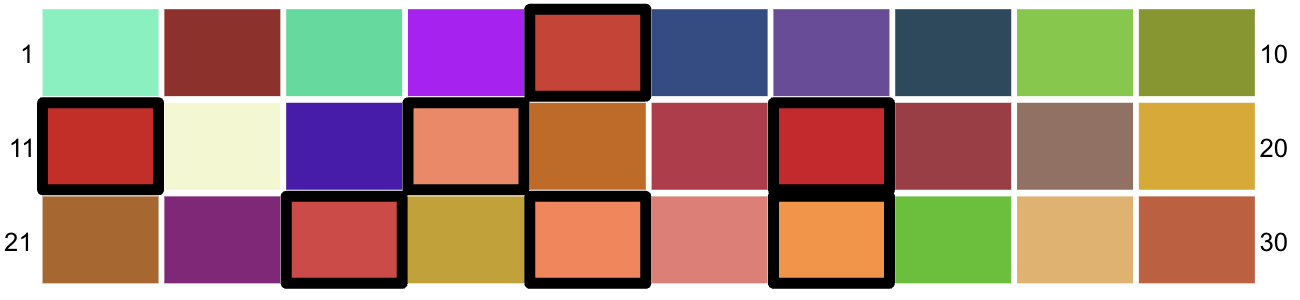
Also, this image is an array of images up to 30 trials. The best ones are surrounded by thick lines.
By looking at the History plot, you can see that colors gradually get closer to the “color of the sunset”.
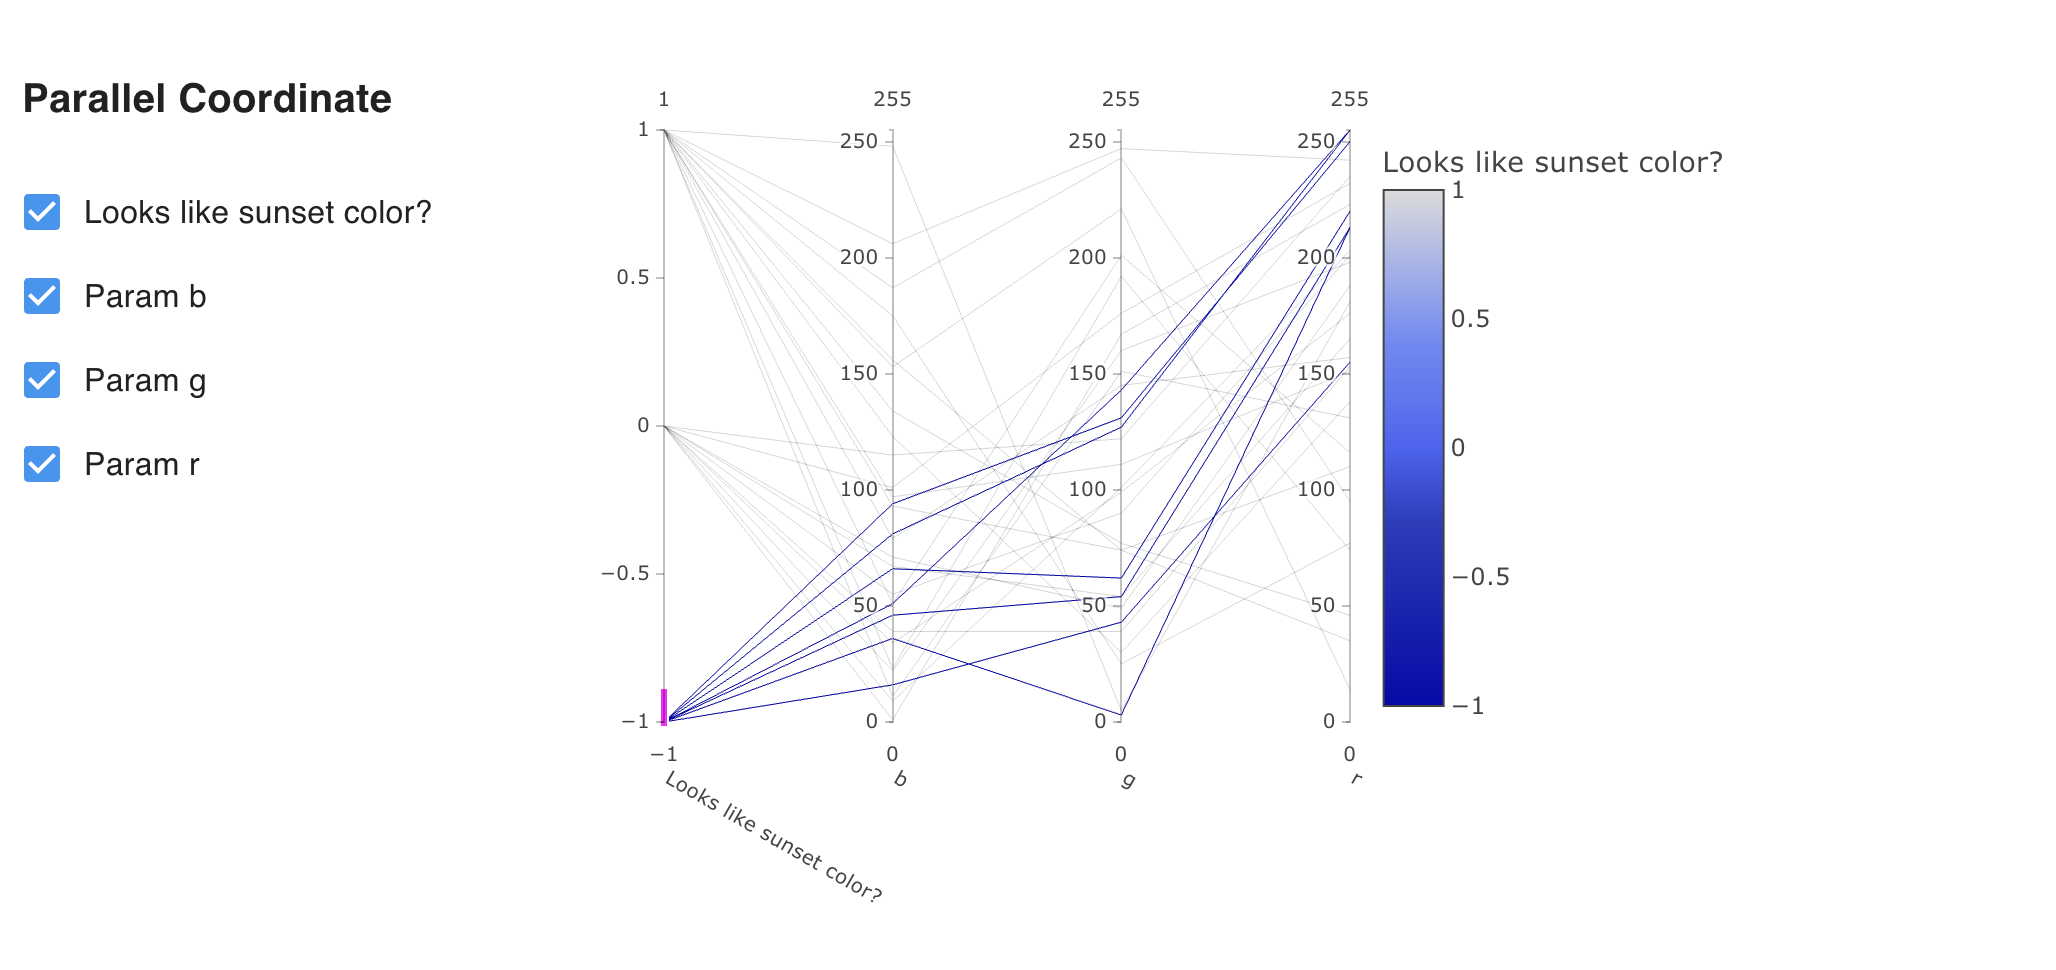
Additionally, by looking at the Parallel Coordinate plot, you can get an insight into the relationship between the evaluation and each hyperparameter.
Various other plots are available. Try exploring.
Script explanation
Let’s walk through the script we used for the optimization.
1def suggest_and_generate_image(
2 study: optuna.Study, artifact_store: FileSystemArtifactStore
3) -> None:
4 # 1. Ask new parameters
5 trial = study.ask()
6 r = trial.suggest_int("r", 0, 255)
7 g = trial.suggest_int("g", 0, 255)
8 b = trial.suggest_int("b", 0, 255)
9
10 # 2. Generate image
11 image_path = f"tmp/sample-{trial.number}.png"
12 image = Image.new("RGB", (320, 240), color=(r, g, b))
13 image.save(image_path)
14
15 # 3. Upload Artifact
16 artifact_id = upload_artifact(trial, image_path, artifact_store)
17 artifact_path = get_artifact_path(trial, artifact_id)
18
19 # 4. Save Note
20 note = textwrap.dedent(
21 f"""\
22 ## Trial {trial.number}
23
24 
25 """
26 )
27 save_note(trial, note)
In the suggest_and_generate_image function, a new Trial is obtained and new hyperparameters are suggested for that Trial. Based on those hyperparameters, an RGB image is generated as an artifact. The generated image is then uploaded to the Artifact Store of the Optuna, and the image is also displayed in the Dashboard’s Note. For more information on how to use the Note feature, please refer to the API Reference of save_note().
 1def start_optimization(artifact_store: FileSystemArtifactStore) -> NoReturn:
 2    # 1. Create Study
 3    study = optuna.create_study(
 4        study_name="Human-in-the-loop Optimization",
 5        storage="sqlite:///db.sqlite3",
 6        sampler=optuna.samplers.TPESampler(constant_liar=True, n_startup_trials=5),
 7        load_if_exists=True,
 8    )
 9
10    # 2. Set an objective name
11    study.set_metric_names(["Looks like sunset color?"])
12
13    # 3. Register ChoiceWidget
14    register_objective_form_widgets(
15        study,
16        widgets=[
17            ChoiceWidget(
18                choices=["Good 👍", "So-so👌", "Bad 👎"],
19                values=[-1, 0, 1],
20                description="Please input your score!",
21            ),
22        ],
23    )
24
25    # 4. Start Human-in-the-loop Optimization
26    n_batch = 4
27    while True:
28        running_trials = study.get_trials(deepcopy=False, states=(TrialState.RUNNING,))
29        if len(running_trials) >= n_batch:
30            time.sleep(1)  # Avoid busy-loop
31            continue
32        suggest_and_generate_image(study, artifact_store)
The function start_optimization defines our loop for HITL optimization to generate an image resembling a sunset color.
First, at #1, a Study of Optuna is created using TPESampler. Setting
load_if_exists=Trueallows a Study to exist and be reused and the experiment to be resumed if it has already been created. The reason for settingconstant_liar=Truein TPESampler is to prevent similar hyperparameters from being sampled even if the trial is executed several times simultaneously (in this example, four times).At #2, the name of the objective that the
ChoiceWidgettargets is set using the study.set_metric_names function. In this case, the name “Looks like sunset color?” is set.At #3, the
ChoiceWidgetis registered using theregister_objective_form_widgets()function. This widget is used to ask users for evaluation to find the optimal hyperparameters. In this case, there are three options: “Good 👍”, “So-so👌”, and “Bad 👎”, each with an evaluation value of -1, 0, and 1, respectively. Note that Optuna minimizes objective values by default, so -1 is Good. Other widgets for evaluation are also available, so please refer to the API Reference for details.At #4, the
suggest_and_generate_imagefunction is used to generate an RGB image. Here, the number of currently running (TrialState.RUNNING) trials is periodically checked to ensure that four trials are running simultaneously. The reason why trials are executed in batches like this is that it generally may take a long time to obtain results from trial execution. By performing batch parallel processing, time waiting for the next results can be reduced. In this case, because generating the images is instant, it’s not necessary, but demonstrates practices.
 1def main() -> NoReturn:
 2    tmp_path = os.path.join(os.path.dirname(__file__), "tmp")
 3
 4    # 1. Create Artifact Store
 5    artifact_path = os.path.join(os.path.dirname(__file__), "artifact")
 6    artifact_store = FileSystemArtifactStore(artifact_path)
 7
 8    if not os.path.exists(artifact_path):
 9        os.mkdir(artifact_path)
10
11    if not os.path.exists(tmp_path):
12        os.mkdir(tmp_path)
13
14    # 2. Run optimize loop
15    start_optimization(artifact_store)
In the main function, at first, the locations of the Artifact Store is set.
At #1, the FileSystemArtifactStore is created, which is one of the Artifact Store options used in the Optuna. Artifact Store is used to store artifacts (data, files, etc.) generated during Optuna trials. For more information, please refer to the API Reference.
At #2, start_optimization() function, which is described above, is called.
After that, two folders are created, artifact and tmp, and then start_optimization function is called to start the HITL optimization using Optuna.