Getting Started
Optuna Dashboard
Installation
Prerequisite
Optuna Dashboard supports Python 3.8 or newer.
Installing from PyPI
You can install optuna-dashboard via PyPI or Anaconda Cloud.
$ pip install optuna-dashboard
Installing from the source code
Since it requires to build TypeScript files, pip install git+https://.../optuna-dashboard.git does not actually work.
Please clone the git repository and execute following commands to build sdist package:
$ git clone git@github.com:optuna/optuna-dashboard.git
$ cd optuna-dashboard
# Node.js v22 is required to compile TypeScript files.
$ make tslib
$ cd optuna_dashboard
$ pnpm install
$ pnpm run build:prd
$ cd ..
$ python -m build --sdist
Then you can install it like:
$ pip install dist/optuna-dashboard-x.y.z.tar.gz
See CONTRIBUTING.md for more details.
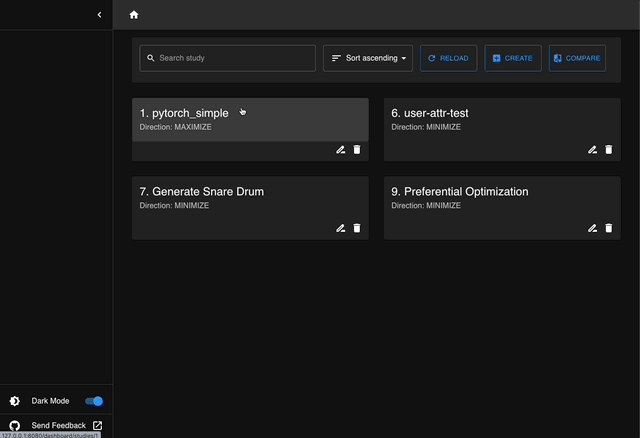
Command-line Interface
The most common usage of Optuna Dashboard is using the command-line interface.
Assuming that Optuna’s optimization history is persisted using RDBStorage,
you can use the command line interface like optuna-dashboard <STORAGE_URL>.
import optuna

def objective(trial):
    x = trial.suggest_float("x", -100, 100)
    y = trial.suggest_categorical("y", [-1, 0, 1])
    return x**2 + y

study = optuna.create_study(
    storage="sqlite:///db.sqlite3",  # Specify the storage URL here.
    study_name="quadratic-simple"
)
study.optimize(objective, n_trials=100)
print(f"Best value: {study.best_value} (params: {study.best_params})")
$ optuna-dashboard sqlite:///db.sqlite3
Listening on http://localhost:8080/
Hit Ctrl-C to quit.
If you are using JournalStorage classes introduced in Optuna v3.1, you can use them like below:
# JournalFileStorage
$ optuna-dashboard ./path/to/journal.log

# JournalRedisStorage
$ optuna-dashboard redis://localhost:6379
For complex setups with LLM integration or artifact storage, you can use TOML configuration files:
$ optuna-dashboard --from-config config.toml
See Configuration for detailed configuration options.
Using an official Docker image
You can also use an official Docker image instead of setting up your Python environment. The Docker image only supports SQLite3, MySQL(PyMySQL), and PostgreSQL(Psycopg2).
SQLite3
$ docker run -it --rm -p 127.0.0.1:8080:8080 -v `pwd`:/app -w /app ghcr.io/optuna/optuna-dashboard sqlite:///db.sqlite3
MySQL (PyMySQL)
$ docker run -it --rm -p 127.0.0.1:8080:8080 ghcr.io/optuna/optuna-dashboard mysql+pymysql://username:password@hostname:3306/dbname
PostgreSQL (Psycopg2)
$ docker run -it --rm -p 127.0.0.1:8080:8080 ghcr.io/optuna/optuna-dashboard postgresql+psycopg2://username:password@hostname:5432/dbname
Python Interface
Python interfaces are also provided for users who want to use other storage implementations (e.g. InMemoryStorage).
You can use run_server() function like below:
import optuna
from optuna_dashboard import run_server

def objective(trial):
    x = trial.suggest_float("x", -100, 100)
    y = trial.suggest_categorical("y", [-1, 0, 1])
    return x**2 + y

storage = optuna.storages.InMemoryStorage()
study = optuna.create_study(storage=storage)
study.optimize(objective, n_trials=100)

run_server(storage)
Using Gunicorn or uWSGI server
Optuna Dashboard uses wsgiref module, which is in the Python’s standard libraries, by default.
However, as described here, wsgiref is implemented for testing or debugging purpose.
You can switch to other WSGI server implementations by using wsgi() function.
from optuna.storages import RDBStorage
from optuna_dashboard import wsgi

storage = RDBStorage("sqlite:///db.sqlite3")
application = wsgi(storage)
Then please execute following commands to start.
$ pip install gunicorn
$ gunicorn --workers 4 wsgi:application
or
$ pip install uwsgi
$ uwsgi --http :8080 --workeers 4 --wsgi-file wsgi.py
Jupyter Lab Extension (Experimental)
You can install the Jupyter Lab extension via PyPI.
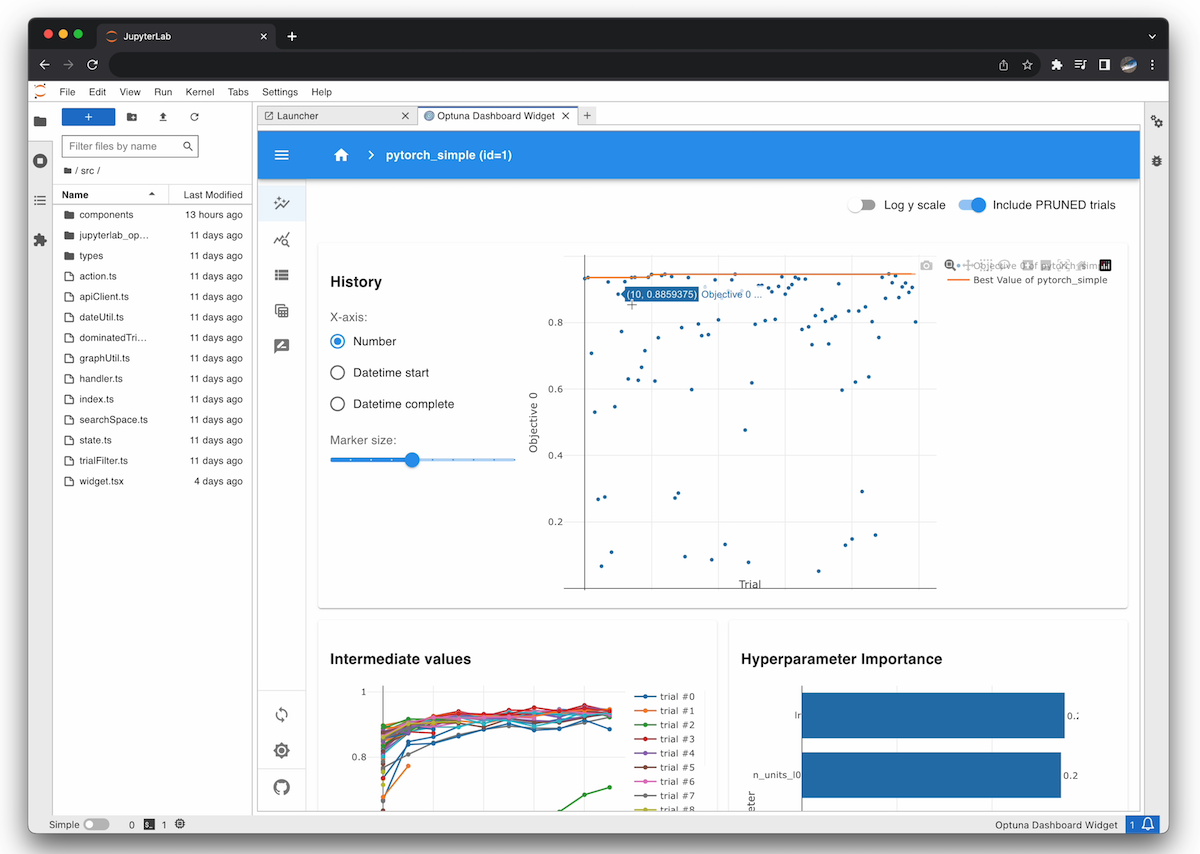
Jupyter Lab Extension
To use, click the tile to launch the extension, and enter your Optuna’s storage URL (e.g. sqlite:///db.sqlite3) in the dialog.
Browser-only version (Experimental)
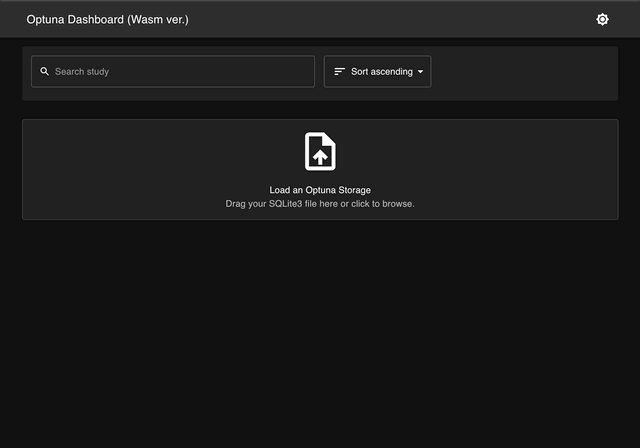
Browser-only version of Optuna Dashboard, powered by Wasm.
We’ve developed the version that operates solely within your web browser. There’s no need to install Python or any other dependencies. Simply open the following URL in your browser, drag and drop your SQLite3 file onto the page, and you’re ready to view your Optuna studies!
https://optuna.github.io/optuna-dashboard/
Warning
Currently, only a subset of features is available. However, you can still check the optimization history, hyperparameter importances, and etc. in graphs and tables.
VS Code and code-server Extension (Experimental)
You can install the VS Code extension via Visual Studio Marketplace, or install the code-server extension via Open VSX.
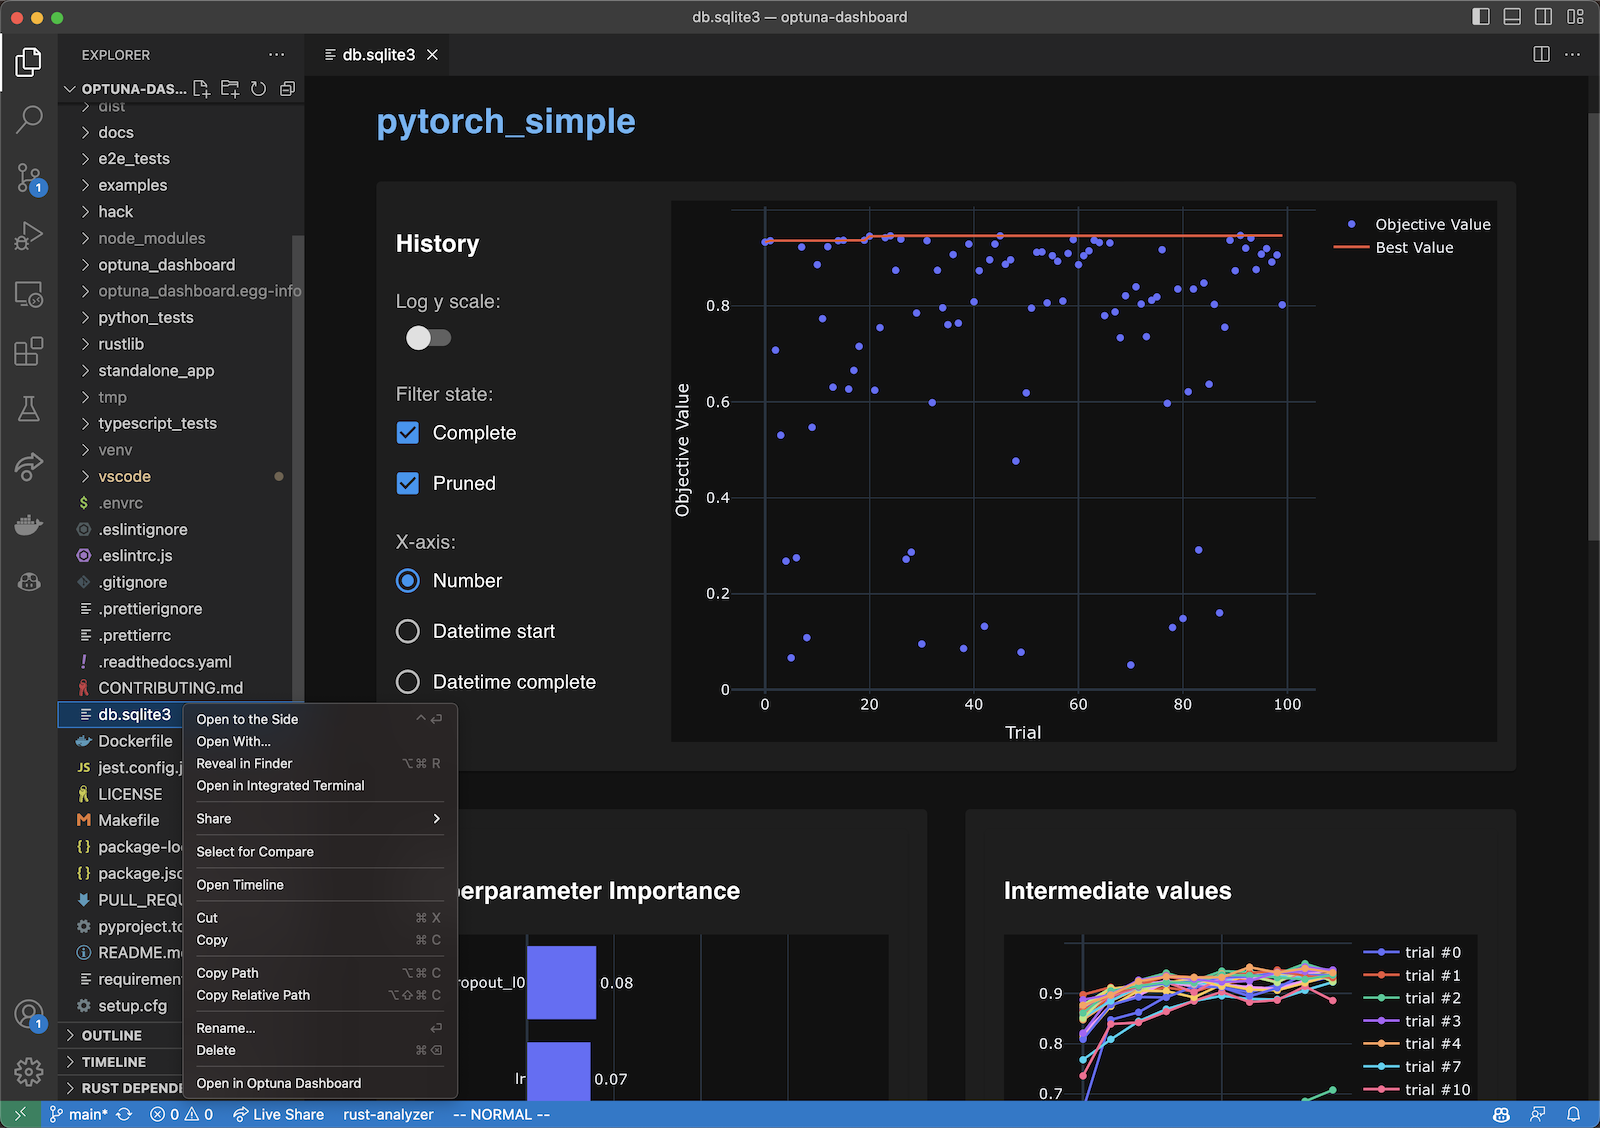
VS Code Extension
To use, right-click the SQLite3 files (*.db or *.sqlite3) in the file explorer and select the “Open in Optuna Dashboard” from the dropdown menu.
This extension leverages the browser-only version of Optuna Dashboard, so the same limitations apply.